This project investigated how sensory modalities (Visual, Haptic, Visuohaptic) influence user performance in a Virtual Reality (VR) environment. Key metrics analyzed included error rates and response times across conditions, providing insights into how sensory feedback impacts task performance.
Data Cleaning and Preprocessing
Participants with overall performance below 60% (fewer than 54 correct responses out of 90) were excluded to ensure data quality. This threshold was based on the binomial probability distribution, ensuring participants performed significantly above chance (p<0.05). The final analysis included 20 participants.
Statistical Analysis Framework
– Shapiro-Wilk Test: Data normality.
– Repeated Measures ANOVA: Used for normally distributed error rates, with Greenhouse-Geisser corrections for sphericity violations.
– Friedman Test: Applied to non-normally distributed response times.
– Effect Size Reporting: Cohen’s d for the magnitude of observed effects.
– Bonferroni Corrections: Controlled for multiple comparisons for reliability.
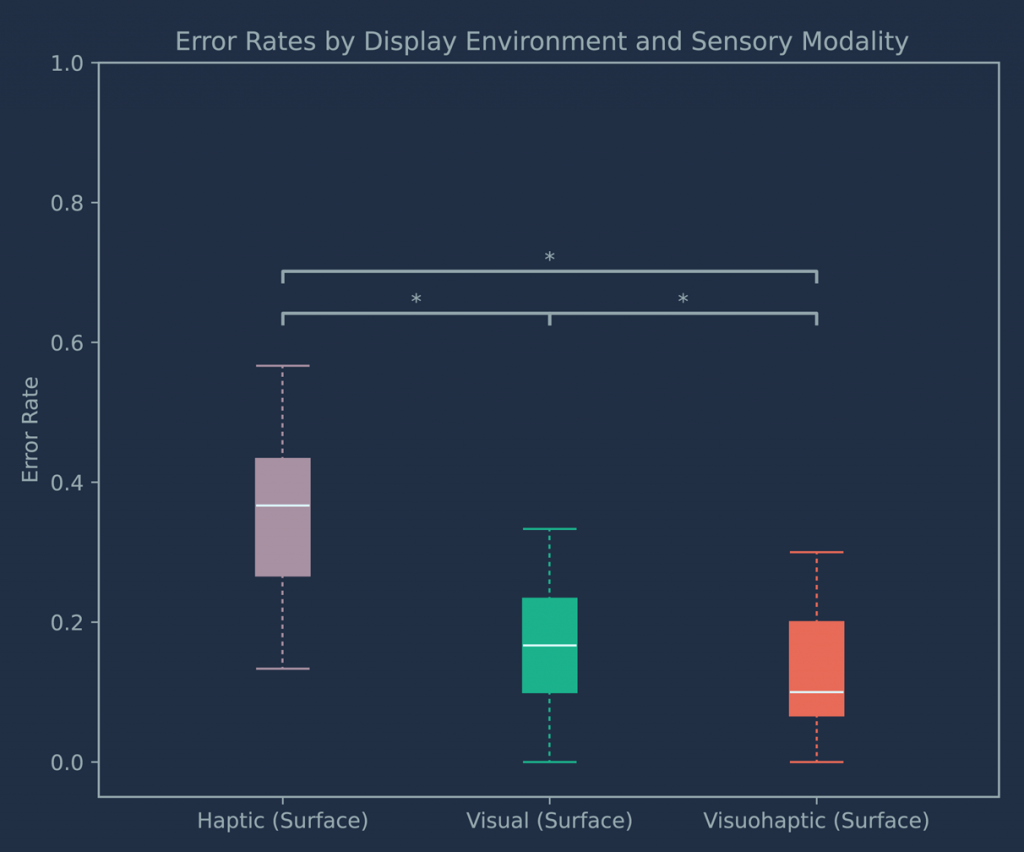
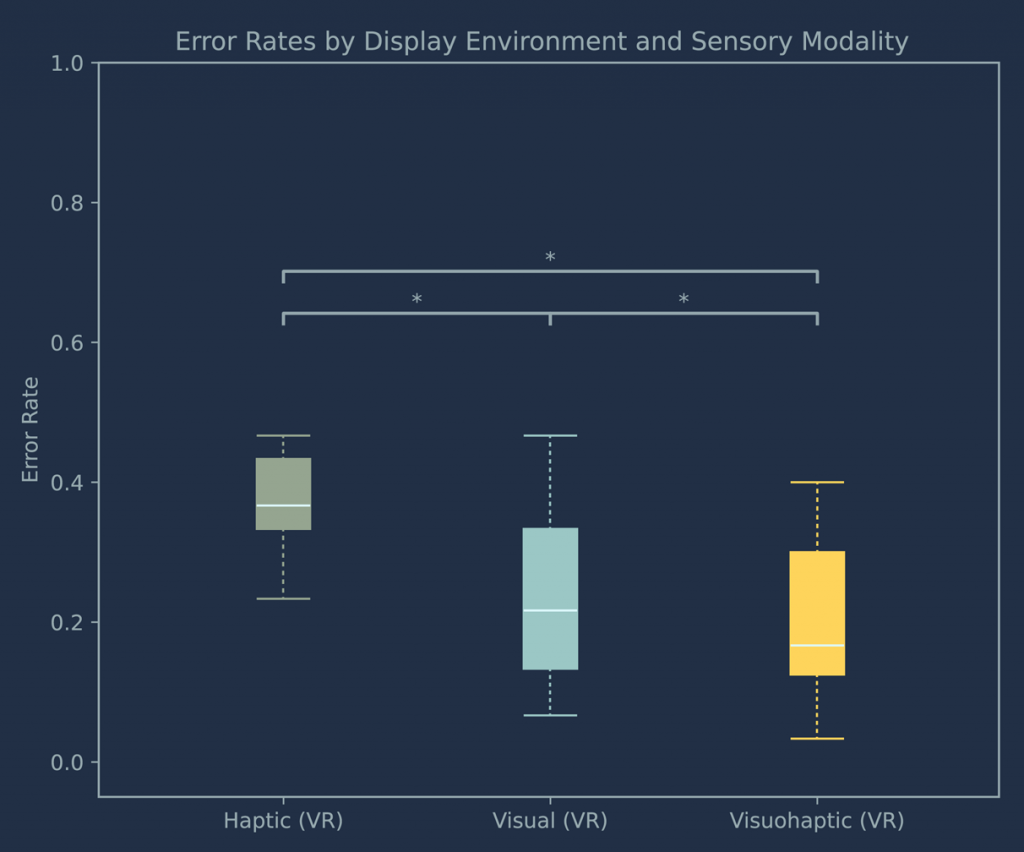
Significant error rates differences were found (F(2,38)=30.59, p<0.001). The Visual vs. Visuohaptic post-hoc t-test showed: (t(19)=3.3, p=0.011, d=0.41).
Non-parametric testing (χ2(2) = 10.9, p = 0.004) revealed significant main differences in response times, but Bonferroni-corrected Wilcoxon signed-rank post-hoc tests did not reveal significant differences between visual and visuohaptic encoding (p>.05).
The complete analysis, including preprocessing, statistical modeling, and visualizations, is documented in a public GitHub repository at https://github.com/lsrodri/VHMatch.
This data analysis was included in my NordiCHI 24 article Comparing the Effects of Visual, Haptic, and Visuohaptic Encoding on Memory Retention of Digital Objects in Virtual Reality.