In this project, I explored how display environments (Virtual Reality vs. Projected Surface) and sensory modalities (Visual, Haptic, Visuohaptic) influence user performance in terms of error rates and response times. Using advanced statistical tools, I processed and interpreted the data to uncover actionable insights into human-computer interaction.
Data Cleaning and Preprocessing
Ensure data quality by excluding participants with error rates exceeding 40%, as this cutoff approximates the minimum score required to be performing significantly above chance at p < .05 according to a binomial probability distribution.
Statistical Analysis Framework
– Shapiro-Wilk Test: Data normality.
– ANOVA (with Greenhouse-Geisser correction): Compared performance across sensory modalities.
– Friedman Test: Analyzed non-parametric data.
– Aligned Rank Transform ANOVA and Linear Mixed Models (LMMs): Merged and processed mixed designs datasets.
– Bonferroni Corrections: Controlled for multiple comparisons for reliability.
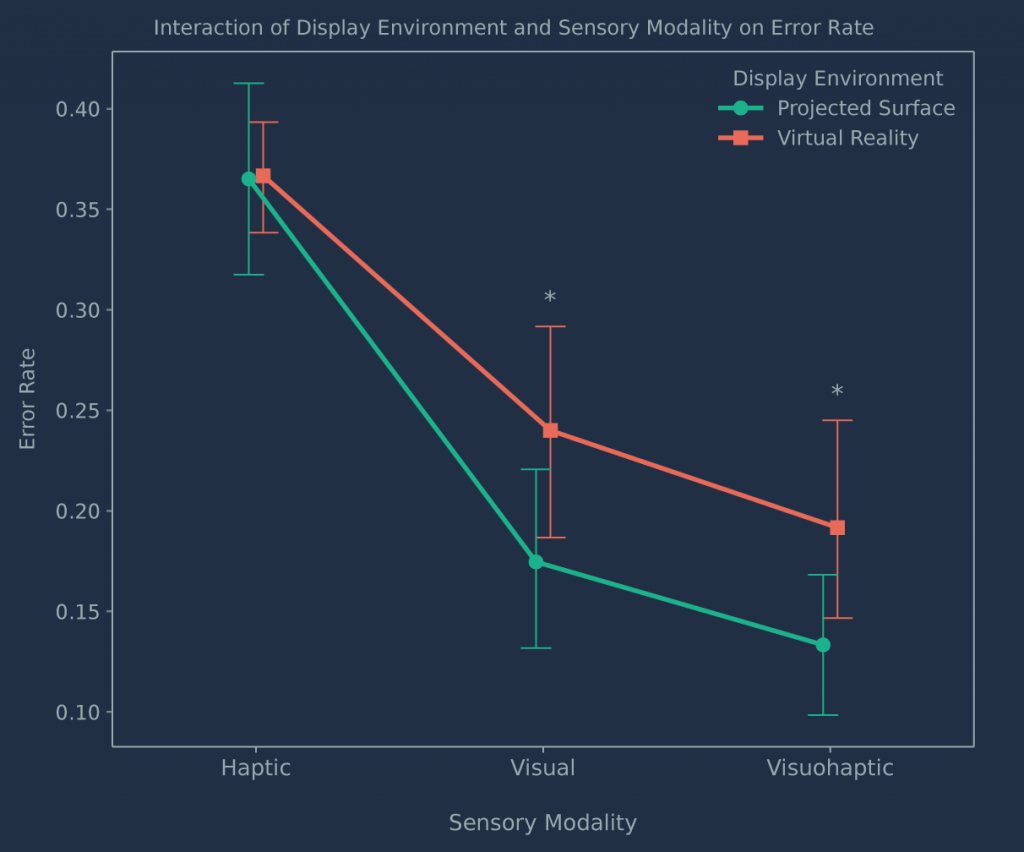
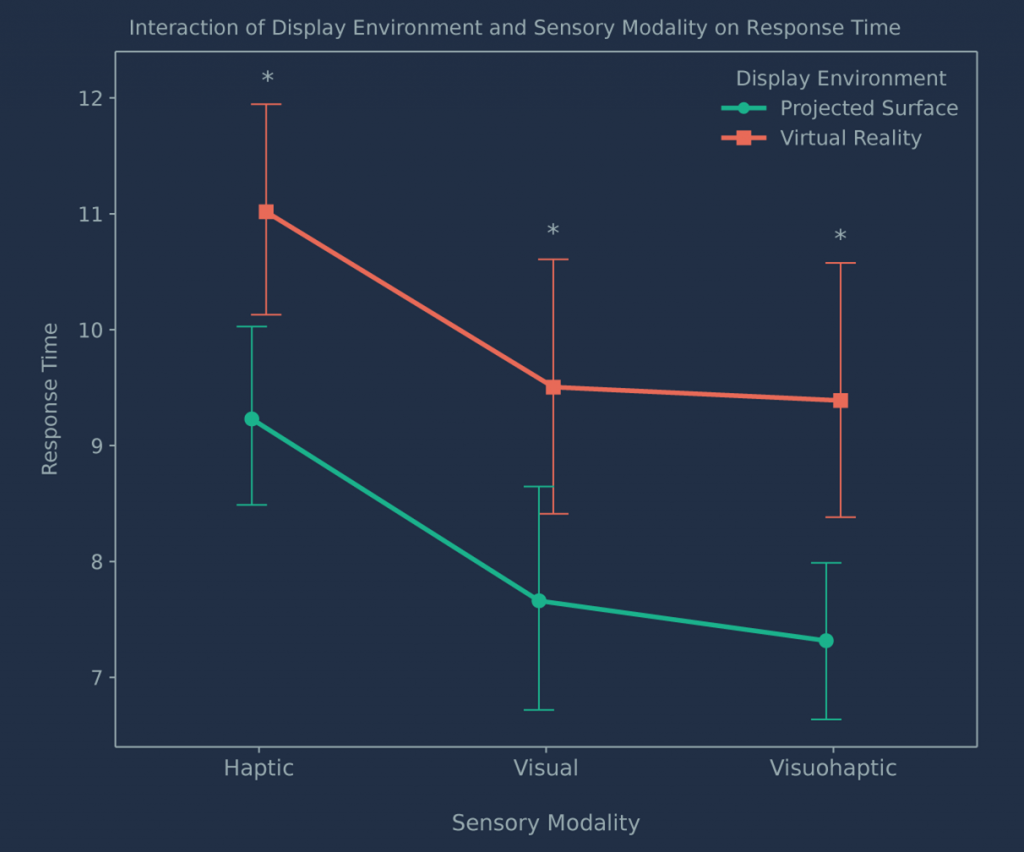
Significant main effects were observed for sensory modality (F(2,117)=47.76, p<0.001) and display environment (F(1,117)=24.01, p<0.001), with consistently better performance in the Projected Surface condition. However, the interaction between display environment and sensory modality was not significant for either error rates (F(2,117)=0.94, p=0.39) or response times (F(2,117)=0.08, p=0.93).
The complete analysis, including preprocessing, statistical modeling, and visualizations, is documented in a public GitHub repository at https://github.com/lsrodri/VHMatch2D.
This data analysis was included in my ACM ISS journal article Assessing the Effects of Sensory Modality Conditions on Object Retention across Virtual Reality and Projected Surface Display Environments.